Alerting From Grafana
Alerting from Metrics Using Grafana
Grafana provides detailed documentation about their Alerting Engine. Read their documentation for deep insight into how it works, or continue ahead for how we use the alerting at Target.
Configure a Grafana Notification Channel
To alert from Grafana, first you need to create a Notification Channel.
- Click the Grafana icon in the top left and select Alerting > Notification Channels.
- Click New Channel:
- Name: Choose a name that makes sense to people outside of your team; for instance, ‘TTS Measurement Team - Webhook’ rather than ‘my team’ and ‘TTSMT’.
- Type: Choose the way which you would like to be alerted. For supported methods and how to configure them, please [read below](#Configure your-Dashboard-to-Alert).
- Send on all alerts: Do not click this if you are in the main org. Checking this box will cause this Notification Channel to trigger on every alert in the given Grafana Org.
- Click Send Test to verify that your configuration is correct.
Configure your Dashboard to Alert
Alerts are created within dashboards. Prior to creating an alert, ensure that you have an existing dashboard that accurately depicts your data.
-
Select the dashboard panel that contains the metric from which you would like to generate an alert and choose Edit.
-
Click Alert, then Create Alert.
-
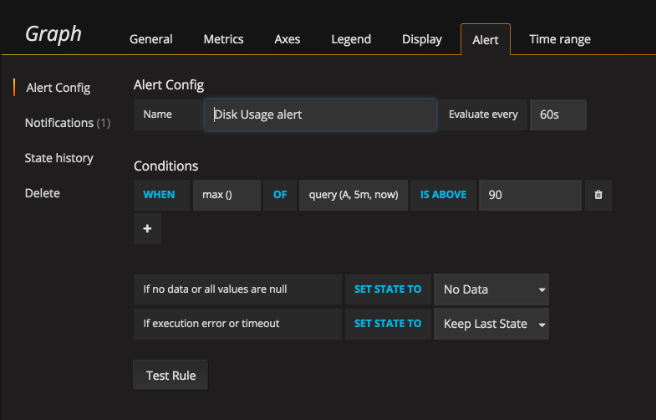
In the Alert Config section:
-
Name: Enter a name for your alert. This appears as the subject in GoAlert and Slack.
-
Conditions: Choose the parameters for when to generate an alert.
-
Click Test Rule. The test displays true if the alert would trigger based on the current conditions and false if it would not.
-
Clicking Test Rule does not generate a rule to your notification channel. It only tells you whether your data met the criteria to trigger an alert or not.

- In the Notifications section:
- Send to: Click the + and choose where to send the alert.
- Message: Add information to explain what is happening or the steps to take to resolve the issue. This shows up in the body of your notification. [

- Save your dashboard. The alert is now set.
No Data or Execution Error
On the Alert -> Alert Config page, there are two dropdown options which aren’t explained clearly in Grafana.
- If no data or all values are null - When this is set, a “No Data” alert will fire to say there is no data in your Query Condition timeframe (default 5 minutes).
- If you would like to be notified when we are not receiving your metrics, Set State To
Alerting.- Warning - This will also fire when there is lag in the metrics pipeline. This alert may still be interesting, because it allows you to know when you have a lack of visibility into your metrics.
- If you would not like to be notified when there is lag, or when we have not received your metrics, Set State To
Keep Last State.
- If you would like to be notified when we are not receiving your metrics, Set State To
- If execution error or timeout - This is when there is an execution error between Grafana and InfluxDB. You don’t want to be alerted based off the Measurement team’s backend infrastructure, so this should always be set to
Keep Last State.
Notable Grafana Alerting Limitations
Grafana determines whether an alert should or should not be triggered at a tile level; therefore, heed the following example:
- One tile shows the CPU of two hosts
- Host A violates the threshold and sets the tile to “Alerting”.
- Host B violates the threshold (remove violation). The tile is already alerting because of Host A, so the second violation (Host B) does not cause another notification to be sent.
- Host A resolves its CPU issue and changes to “OK”. Although that host is “OK”, since Host B is still “Alerting”, the tile is still alerting. Therefore, Host A does not send an “OK” notification. An “OK” notification is only sent once both hosts have resolved.
If there is only one line on the graph, this should not be an issue.
Grafana cannot create an alert on a tile which has a template. To overcome this, a duplicate of the tile can be made which uses the specific metric/tags combination you’d like to alert on. Documentation here. Issue here.
Grafana doesn’t currently handle responses from webhook notifications, so if any of these calls fail, you are not notified that the alert was not created successfully.